Leonard Bernstein
en
Tableu vectoriel
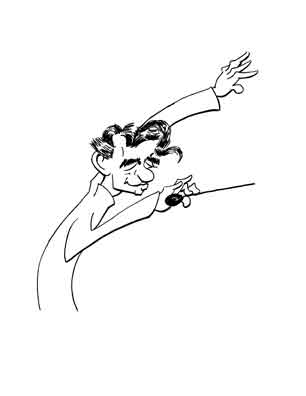

| Á gauche: | Traditionnel dessiné à la main |
| Á droite: | Vectoriel |
What is this?1 Double dipping again? Or should we say triple dipping?
Footnote
Romeo and Juliet, Act III, Scene IV, William Shakespeare (author), Edward Blount and William and Isaac Jaggard (publishers), 1623.
By no means. These pictures are simply to demonstrate how modern technology comes to the aid of artists in using their art to help eradicate ignorance and superstition.
Although the role of illustrators has often been relegated to levels below the fine artist, it is the illustrators who are directly involved with increasing understanding of difficult topics. After all, it wasn't Francis Crick and James Watson who drew the picture of the DNA molecule without which the understanding of the structure would have been impossible. It was Francis's wife, Odile, a trained artist.
And the rule of illustrators from time immemorial is "Work Large / Then Reduce". And they weren't talking about shedding a few pounds after sitting at their desks for days at a time, easy snacks within reach. Instead this meant that the original artwork should be rendered larger than it will appear when reproduced. That way the errors and imperfections will hopefully be shrunk down to nothingness.2
Footnote
The actual process of reproduction can also remove imperfections. It was quite common for illustrators to make corrections using correction fluid - essentially white paint - which is evident on the originals. Sometimes the correction fluid could be piled on so thick the art might have the texture of impressionistic impasto art. But the bumps and patches would often disappear on the photographic reproduction.
But working large for reduction requires the illustrator to work simpler and avoid intricate detail. For instance, if you paint a medieval knight in chain mail on a 36" X 24" canvas, if you put every link on the mail, when it reduces down you might end up with nothing but a black mass. The advice of Henry David Thoreau is apt: Simplify! Simplify! Simplify!
For instance if you see the original paintings of N. C. Wyeth that were used for illustrating the books, Kidnapped, Treasure Island, The Black Arrow, and such, they are quite large. Two by three feet isn't unusual, many are larger, and at least one is over ten feet long. But in the books they're maybe 7" X 5" or even smaller.
The rise of computer art didn't change this - not at first. The artist would still draw or paint the illustrations. It would then be photographed or scanned to form a file where the image, whether displayed on a computer screen or printed as a hardcopy, was a series of pixels of the proper color and location. These bitmaps or raster graphics were permanently fixed as a grid.3
Footnote
Computer experts make distinctions between a bitmap (the storage of the bits in the computer) and the raster graphics (the image as displayed). But the two terms are often used interchangeably.
The drawback is these bitmap images can be quite large and so take up a lot of memory. So to minimize the file size to speed up the loading and reduce memory requirements, the practice was to use the minimum resolution required. That is make the image as small as possible for the image to look good.
But if a low resolution image that looked fine on a web page was something you wanted for a t-shirt, the expanded picture will look grainy. And if you wanted the t-shirt to look good, the image printed had to be of high resolution - 300 dpi or even 600 dpi. So keeping with the original principle to work large then reduce, the original art had to be even bigger. Soon your computer will have the massive multi-gigabyte files in storage.
Then at one point, someone realized that the art is stored on a computer. Computers can crunch numbers, put them in equations, and graph the equations.
But a graphed equation is an image. And best of all, it's a simple matter to make them bigger. For instance, if you draw a circle with an equation like:
x2 + y2 = 402 pixels
You can double its radius by displaying the equation:
x2 + y2 = 802 pixels
... and you get:
If you want to fill in the image, you simply use the equation:
x2 + y2 < 802 pixels
... and plot it out:
Now if you take enough shapes and lines and put them together just right you'll get - ah - "art".
Note that you can't do the "View Image" or "Save Image" trick to display the picture in a separate page or save it as a file. That's because there isn't an image to display or save. Instead the computer is using the equations to determine which pixels are made black and which white. Because you can take the graphic image produced and scale it up without loss of resolution, the images are called scalable vector graphics or SVG images.
The point is with enough and the right type of equations, you can produce almost any shape you want. So if you want to expand the image, the equations are recalculated and the bigger picture is drawn. But since the equations keep the resolution at 1 pixel, you don't get a grainy picture even if you blow the picture up hundreds of times. The smoothness of the curves and edges is limited only by the display resolution of the screen or the printer.
We can see the difference of the bitmap and vector graphics that if we return to the two pictures of Lenny:
|
|
Now on most screens you'll see little difference. However, if you expand the images - do the "View Image" stuff and then zoom in - you'll see the bitmap is far more grainy while the vector image is crisper and sharp.
It may help to zoom in on parts of the two images of Lenny. First blow up the bitmap:
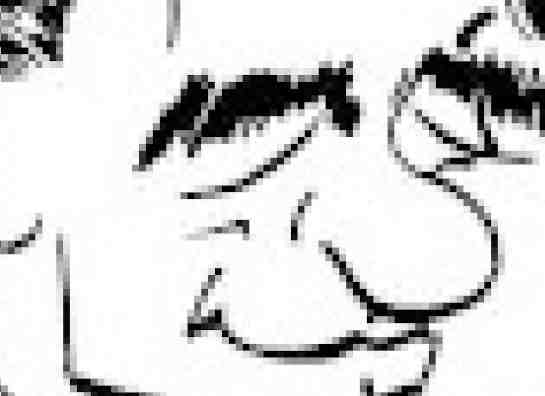
... which is more fuzzy and grainy. Not something you'd put on a t-shirt or poster.
But then zoom in on the vector image of the same file size (25 kilobytes) - which remember is simply a plotting of equations:
